As marketers, we all want to prove the value of our marketing efforts, especially on social media.
But how do you do that?
Nothing beats a concrete, data-driven, simple, and easy-to-understand social media report.
Tracking your social media metrics gives you a complete picture of how all your accounts are performing and you can finally prove whether the social media budget you ask for during the last marketing meeting had any ROI.
But wait, the idea of creating reports bores you to death.
Relax!
In this blog post, we’ll take you step-by-step through building your own analytics report in the simplest and most efficient way.
Let’s get started!
Tips on Custom Marketing Reporting
Creating a custom marketing report involves much more than just finding out who followed you or which photo they liked.
A custom report allows you to turn such data into actionable insights.
By tracking your social media account metrics and insights over time and thoroughly analyzing them you’ll continue building a successful social media strategy for your clients.
There are a few tips you need to follow when creating custom social media reports:
1. Identify Your Social Media Marketing Goals
Before you do anything you must first understand why you’re doing it. Similarly, before you start creating your social media report, you must determine your social media goals.
Why are social media goals important?
There is so much that you can add to your report. But, a lot of it might end up being useless.
You don’t want people reading pages of useless data. You’ll end up looking unprofessional and no one will take you or your report seriously.
The metrics and insights to include in your social media report will depend on your social media goals.
For instance, if your goal is to grow your social media following then it won’t be helpful to capture data regarding your website traffic.
But, if you’re trying to drive people to your website then you need to show how social media traffic affected your web traffic.
Determining your goals beforehand allows you to dedicate your social media report to your ongoing activities and show whether you’ve hit your goals and if not, you’ll be able to explain why and how to address your failures efficiently.
While every company’s goals will be a little different, common social media goals include:
- Increase brand awareness
- Drive traffic to your website
- Generate new leads
- Grow revenue
- Boost brand engagement
- Build a community around your business
- Effective social customer service
Identify a set of your own social media goals that will help you make sense of your social media report.
2. Define Your Reporting Time Frame
Do you want to create reports weekly, monthly, quarterly or yearly?
It’s important that you set a time frame.
Your time frame depends on the purpose of the report or your preferred workflow. For instance, if you’re creating a social media campaign report, then the report will cover the timeline of the campaign.
When deciding your time frame it’s also important to consider how you want to evaluate your marketing progress. You can use time-tracking tools to monitor the process which allows tracking your time and reporting your projects.
Common time frames to evaluate are a month over month comparison, or quarterly updates.
3. Keep Your Social Media Report Short and Sweet
Reports can be quite boring especially for people who are not involved in the tasks being evaluated. So, keep things concise and to the point.
Not many people are fans of numbers so make compelling conclusions. Numbers alone cannot tell a story.
Make sense of each number so that your audience can have a better idea of what they mean.
Focus on showing off the value of what you’re doing day-to-day. In short, sum up your wins, losses, and opportunities.
Determining Your Audience: Who’s Seeing the Report?
You may have all the numbers, you may actually be doing a pretty good job with your social media accounts, but if your client doesn’t understand what you’re trying to say, your report won’t be helpful.
A custom report should be based on who’s going to read it.
Is this report meant for the marketing team that is familiar with how social media works? Or is it for the sales director who is not too familiar with social media?
Sometimes you may have to create multiple reports to suit different audiences to make sure that everyone understands what you’re trying to communicate.
Your audience will determine how simple or complex the language of your report will be.
It will also affect the length of your report, your summary and even key takeaways.
For instance, if you’re dealing with the marketing team, you may use industry jargon as they are more likely to understand it without you having to explain. But, the same can’t be said of the Finance team.
The people at the top of the organization’s hierarchy will be more focused on conversions and financial figures. The less familiar your audience is with social media, the more concise your report needs to be.
Determine what’s most important to your audience and focus on those numbers and facts.
As you can see, your report will mainly ride on who needs insights, and why they need them.
Keyhole is a real-time conversation tracker that provides keyword + hashtag analytics and social media analytics across platforms such as Facebook, Twitter and Instagram.
What Information Your Audience Needs In a Report
Your social media report can be as sketchy or as detailed as you want. It all depends on why you’re writing the report.
However, there are a few important details that your report should have to make it more efficient.
1. Report Introduction
Your intro should give your audience context so that they know what to expect and get them excited about the report.
Introduce your report with a quick summary of your goals, your strategy, tactics used, and success metrics. The summary will give context to your audience and let them know what to expect in the rest of the report.
2. Success Overview
Next, provide a quick snapshot of the overall performance. This should contain just a short overview of the most important results. Here, consider what is most important to your audience.
Remember, it’s just a quick overview of the most important analytics. You’ll get into the details in the next section.
3. Data Tracking
This section is all about the numbers and it’s where you get into the details.
The specific data you include in this section will depend on your goals and the related metrics that you’re tracking.
Here are some of the most common metric to include for each of your social networks:
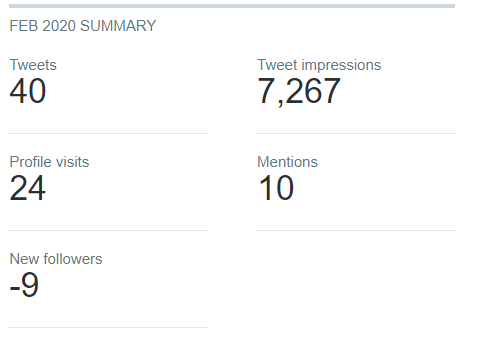
Likes and Follows
Likes and follows are often considered vanity metrics but they are still important numbers to be aware of.
Likes and follows reflect on brand awareness, give you an idea of your potential reach, and show whether or not people like your content enough to follow you on social media.
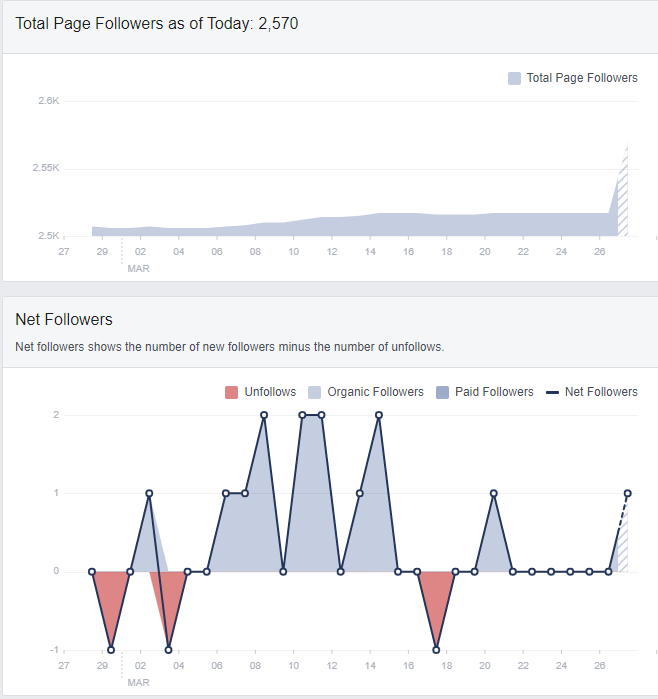
When reporting this metric, show how your likes and follows have grown or declined over your reporting timeframe. In doing so, you show where the brand is at and how much love the brand is getting.
Tracking your followers is a good indication of whether or not your social media strategy is working, so be sure to include these metrics in your analytics report.
Reach and Impressions
Reach and impressions refer to the potential number of people that have seen your social media posts
These metrics are important because they help you and your clients understand how visible your posts are over and above the number of likes and follows you have. This is because some people may see your post but not like or follow.
Reach and impressions, therefore, help put post engagement into perspective.
Engagement
Speaking of post engagement, engagement is another very important metric on its own. Make sure to include the number of engagements your social media accounts have garnered.
You can breakdown engagement in terms of per post, per follower, and total engagement.
Engagement is an important metric because it reveals whether your content resonates with your audience. If it does, then your audience will be interested in and interact with your social media accounts and posts.
Engagement also shows you the quantity and quality of the interactions your social media accounts and posts get. The more engagement you get the more brand exposure you receive.

If your audience is loving your content then they will likely like it, share it, follow you, or even comment on your posts.
Engagement thus lets you know if you need to tweak your content to make it more relevant to your audience
Best Performing Posts
Still on content relevance, track which of your posts perform the best. This kind of metric allows you to see which type of content resonates the most to your audience.
A video post may perform better than your text post or the poll you ran may have gained you more engagement than any other type of content.
Tracking which content performs best every now and then will help you stay up-to-date with trends and inform your content strategy to ensure that you keep giving your audience the content that they want.
Conversions
Having a million likes and followers means nothing to your bottom line if these fans don’t take the desired action.
Whether it is signing up to your weekly newsletter, downloading an app, buying a product, opening an email, scanning a QR code, etc. your fans need to take some kind of action to make it all worth it.
Record metrics on how many people converted from fans to taking the action you wanted them to take.
Clicks and Traffic
If one of your goals is to drive traffic to your website, then you must include this metric in your report.
Track how many clicks your links got. If you are running social media ads the number of clicks each ad received is of paramount importance.
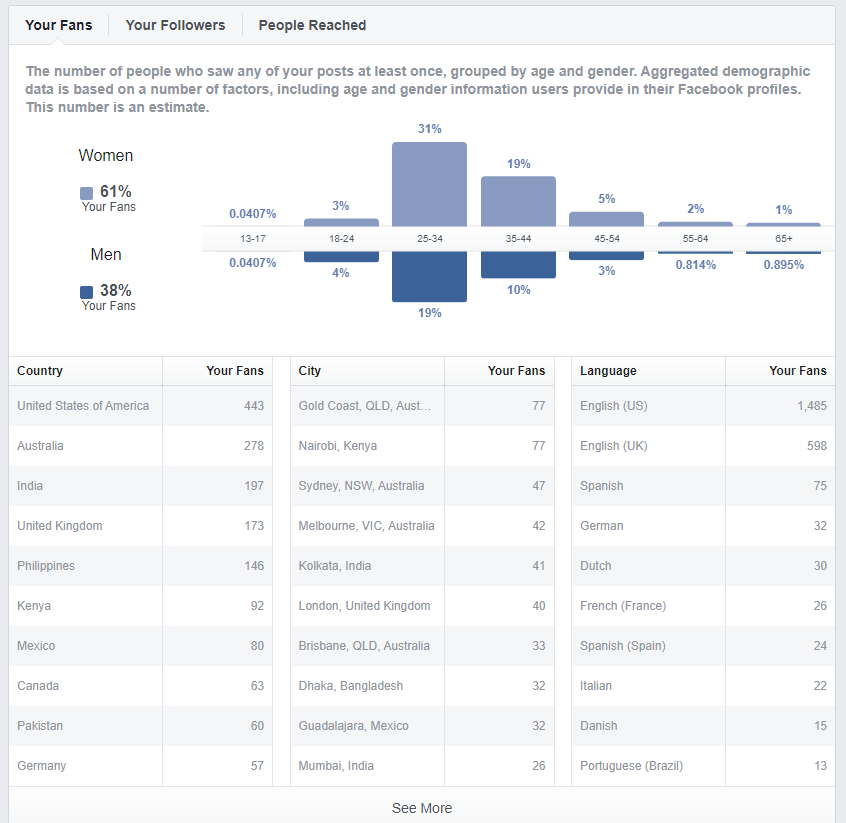
Audience
You have a higher chance of converting someone that is in your target audience than someone who is not.
Find out who your audience on social media is to determine whether you are reaching the right people.
Include data on your most active users, who participates in conversations, most active users, and influencers.
Include a breakdown of your audience’s demographics (location, gender, language, interests, occupation, and age).
Mentions
Include data on the number of times you are mentioned on social media. This metric helps you track your reach and brand awareness.
You certainly want to be aware of what people are saying about your brand and where possible, to be part of that conversation.
There are lots of marketing automation tools that you can use to help you monitor your mentions on social media.
Branded Hashtags
It’s also important to monitor and measure hashtags especially if you are reporting on a specific campaign that includes a branded hashtag.
Seeing how people are interacting with your hashtags gives you an idea of how your brand is performing in terms of awareness and reach. So include this metric in your report.
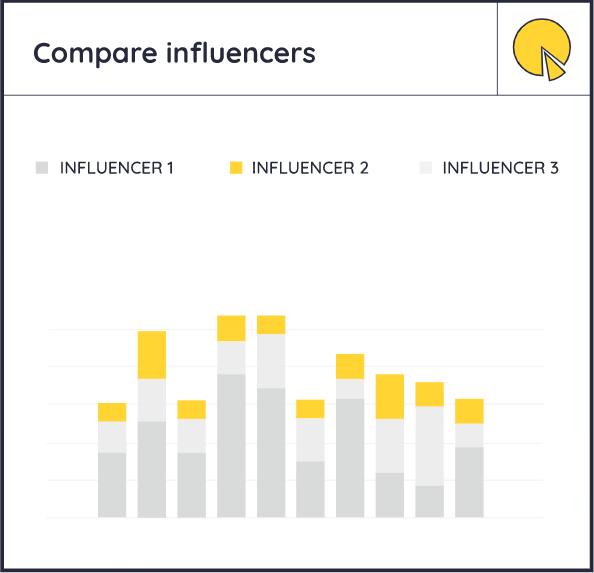
Influencers and Advocates
Working with influencers has a wealth of benefits for any company. However, for influencer marketing to work you need to work with the right influencers.
It’s, therefore, important to track your top influencers and people that interact with and share your content. These are the people who you may want to work with when creating targeted.
4. Analysis
You only gain value from your social media report if your metrics provide some context.
Once you have all your important data recorded, go beyond the numbers by analyzing your metrics and translate them into actions. Show your audience what the numbers mean.
Data on its own is just numbers. Mention what your goals were for the report timeframe and how each metric matched up to these goals to be able to paint a fuller picture.
Next, explain to your audience what you’re going to do based on the numbers that you recorded.
For instance, if video posts are receiving more love than text, you could propose to produce more videos for future posts.
This is where SMART goals come into play.
This section doesn’t need to be wordy. Bullet points will do. You simply need to show that you’re working toward something. Remember we’re trying to keep the reports short and sweet.
Analyzing your data not only helps you understand whether you’re reaching your goals but also guides you on what you need to change to achieve them if you’re not.
5. Conclusion
The summary is an important part of your report. This is the part that most people, especially those not familiar with social media, will be looking forward to.
Conclude your report with a summary of lessons learned, and how those lessons will inform your future strategy.
Presenting Your Information
Remember, numbers are boring, and can be difficult to digest.
Make your report exciting by designing it into an engaging visual that presents your data in a logical and comprehensible way.
When designing your report don’t overthink it and go overboard. Don’t try to fit too much information into one sheet as this overwhelms the reader.
Use visuals as much as possible to catch and keep your audience’s attention. Use graphs, charts, tables, images, bright colours to highlight important details and so on.
There are several formats that you can use to present your report. No one is better than the other and whichever format you choose totally depends on your preference.
Here are a few ways you can build your report:
1. PDF Social Media Report
The easiest way to share your social media report with your client is as a PDF report.
You can easily edit your PDF report with Adobe Acrobat, Adobe Illustrator, or any other PDF editor that you have and them simply attach it to an email and send it to your clients.
PDFs are also easy to print, so you can print a copy for your client and use it to a meeting or file it for future reference.
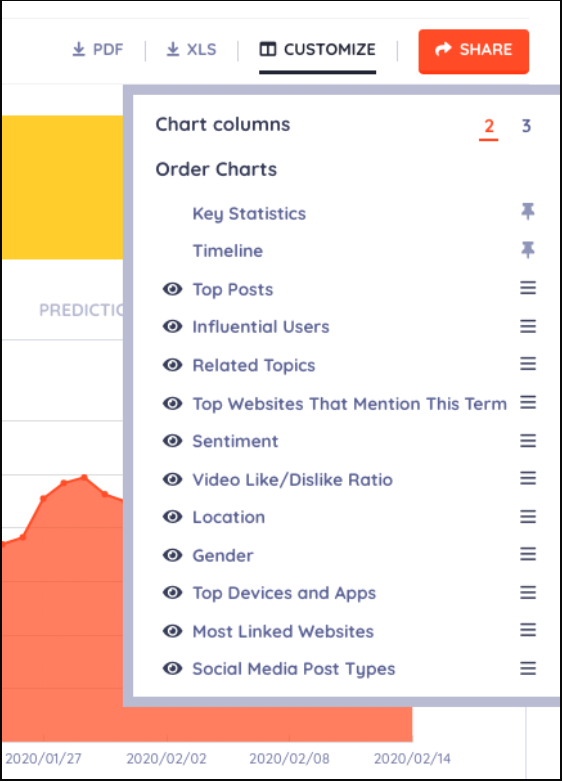
Keyhole allows for users to export data and analytics dashboards into a PDF or Excel sheet. Give it a try here!
2. Excel Spreadsheet
You can also present your social media report as an Excel spreadsheet.
A spreadsheet is especially great when you want to visualize your growth trajectory in one page.
Another added advantage of a spreadsheet is that you can use Excel formulas to easily formulate data comparisons, calculate percentage rates, or display charts and graphs.
Most reporting and social media analytics tools allow you to export your analytics report as a CSV file so you don’t have to do it manually.
3. Google Slides / Powerpoint Deck
Using a 100% editable presentation template offers many benefits. You can easily customize the colors, fonts, and layout to match your brand and style preferences.
Additionally, templates often include pre-designed slide layouts, graphics, and icons that can save you time and effort in creating your slides from scratch.
A well-crafted AI presentation or slideshow template is an excellent way to present your analytics report to your client, whether in-person or in a virtual meeting. It can help to maintain your audience’s attention and make it easier for them to follow along with your data and insights.
It is also a great way to present your analytics report to your client, whether in-person or in a virtual meeting. A slideshow looks more professional and is easy to follow and pay attention to.
Creating a social media report may seem like a complex task, but by breaking it down into simple steps, it becomes easier and even exciting.
Now that we’ve walked you through how to create an efficient social media report, you’re ready to get started!
Related Articles:
Top 25 Social Media Analytics Tools: The Definitive Guide
Marketing Report Essentials: How to Create Perfect Reports and Impress Clients
Keyhole is a real-time conversation tracker that provides keyword + hashtag analytics and social media analytics across platforms such as Facebook, Twitter and Instagram.


